Daily Management System

his allowed everyone to track their performance and make improvements where necessary. We also provided regular feedback to our hourly team members and operators on their performance and how they were contributing to the overall success of the business.

Using Visual Tools to Manage Your Team, Department, or Organization

I am excited as we have rolled out our new Daily Management System and Portland Bottling Company., As a manager in the beverage industry, it’s essential to have a clear and concise visual management system in place. This system should be updated regularly with Key Performance Indicators (KPIs) to ensure that everyone on the team is on the same page. The purpose of a visual management board is to provide everyone with a comprehensive overview of the business’s performance and to promote transparency and accountability, and teamwork.

In this blog post, we will be discussing how we updated our visual management board with KPIs, and how we got our hourly team members and operators involved in the process.

Step 1: Identifying the Key Performance Indicators

The first step in updating our visual management board was to identify the KPIs that would be the most impactful for our team. We considered a range of factors, including production efficiency, product quality, and customer satisfaction, to determine which KPIs would be the most relevant. All team members got to weigh in on the discussion. The critical point is that if your hourly team members are going to “own” the board, they have to be involved in the creation process.

Step 2: Setting Up the Visual Management Board

We chose to go with a basic board but with a twist or two on it.

  1. Since we truly believe that our People are our greatest asset – that KPI comes first.
  2. Secondly, we chose Safety as that easily coincides with taking care of our team members and ensuring compliance with training requirements.

Step 3: Involving the Hourly Team Members and Operators

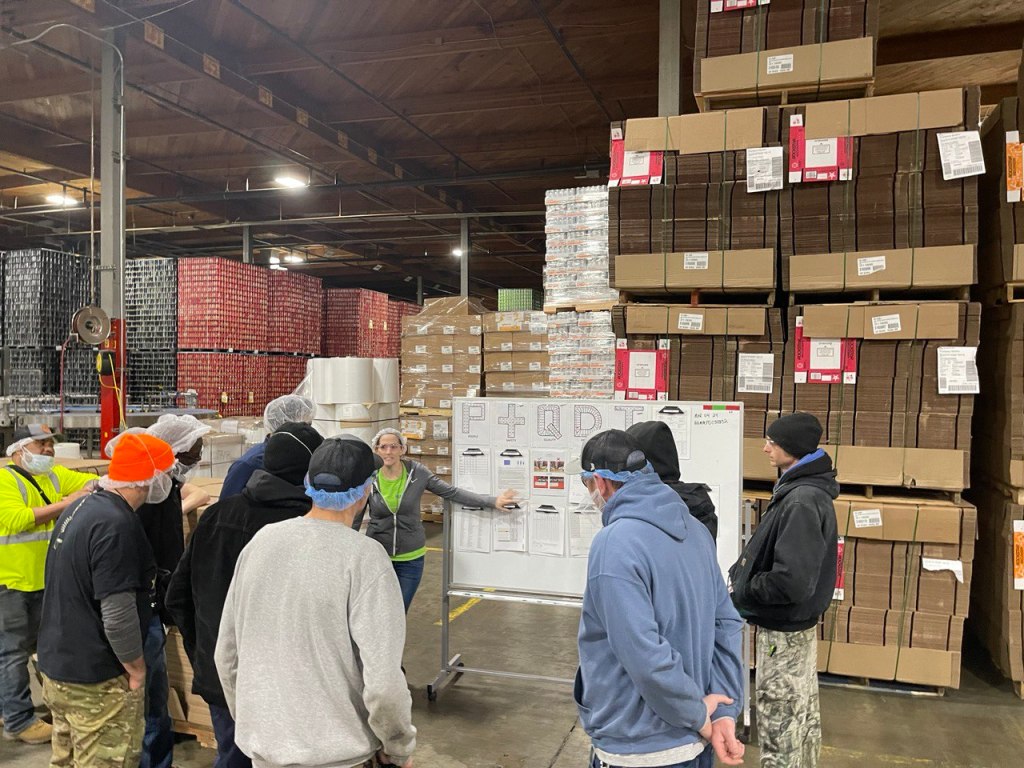
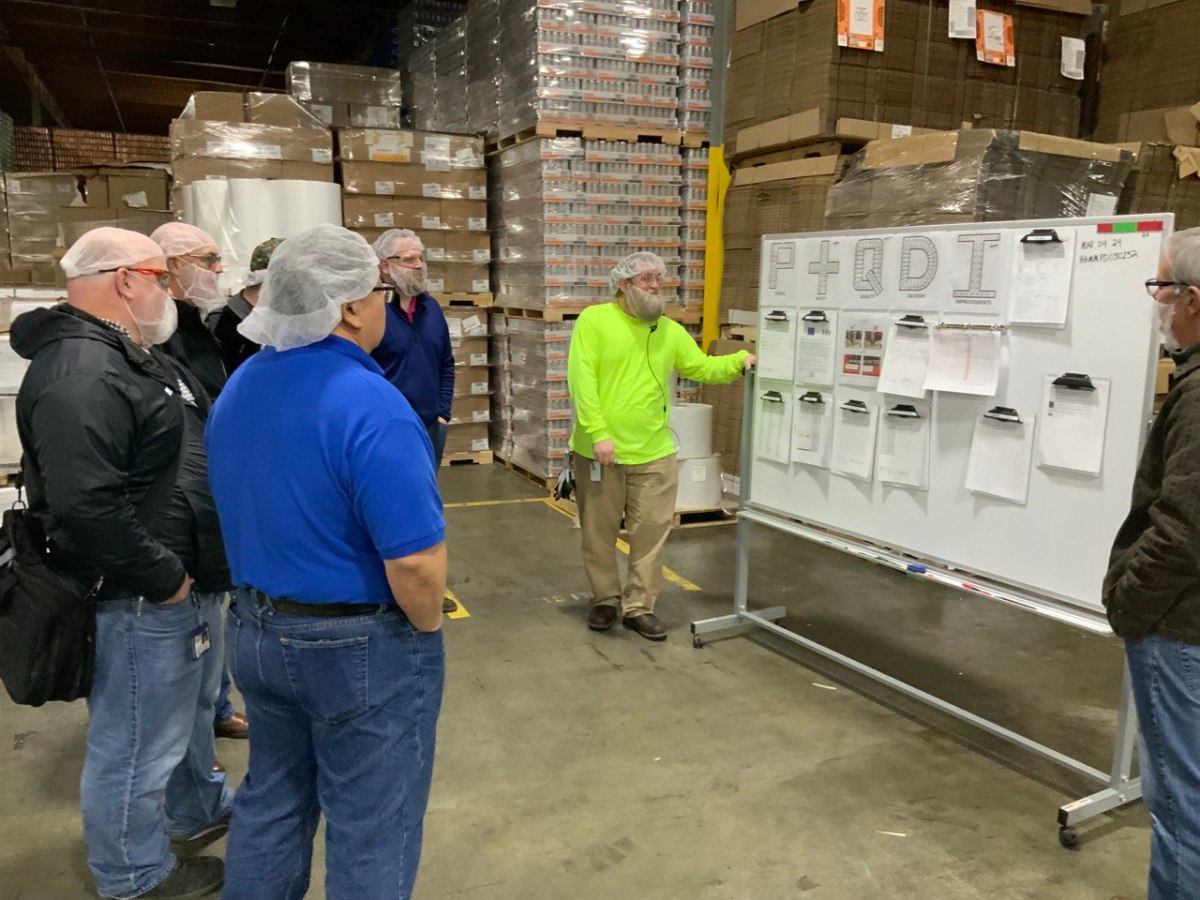
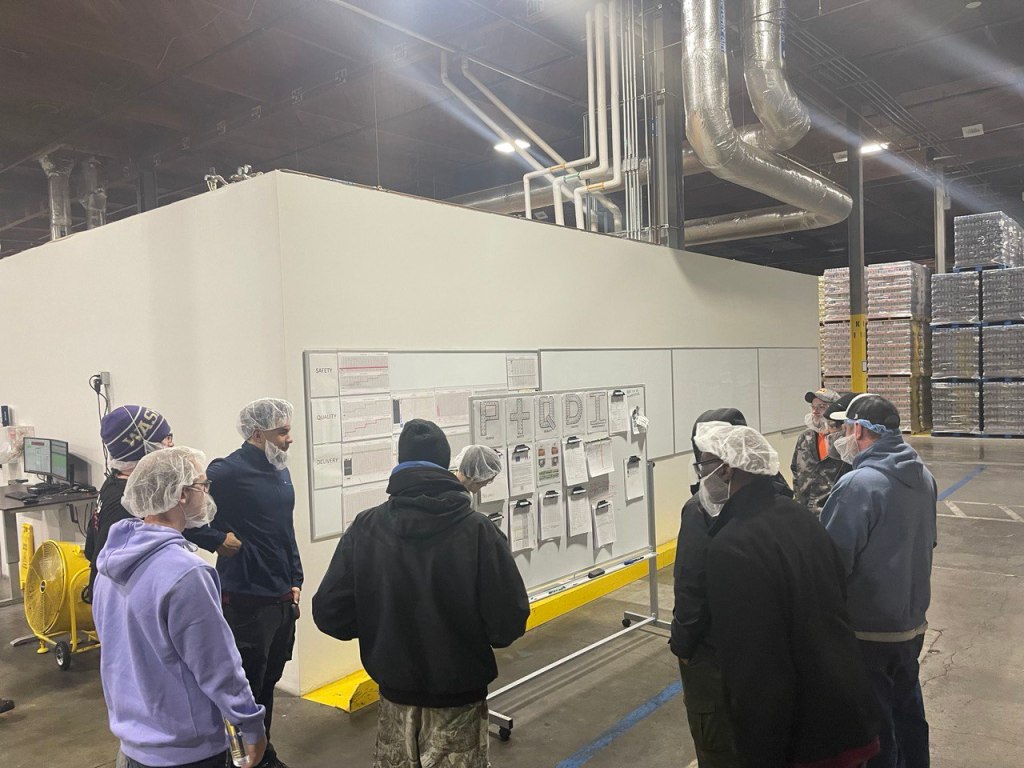
Once we had identified some of the KPIs, we set up a visual management board in our production office area. We held multiple training sessions with multiple departments and even enjoyed “mock” meetings where we got to do a meeting and offer feedback and support to each other. It actually turned out to be quite fun.

The next step was to get our hourly team members and operators involved in the process. We organized a team meeting and invited everyone to discuss the new visual management board. During the meeting, we explained the purpose of the board and how the KPIs would be used to improve production efficiency and customer satisfaction. We also invited everyone to suggest additional KPIs that they believed would be beneficial.

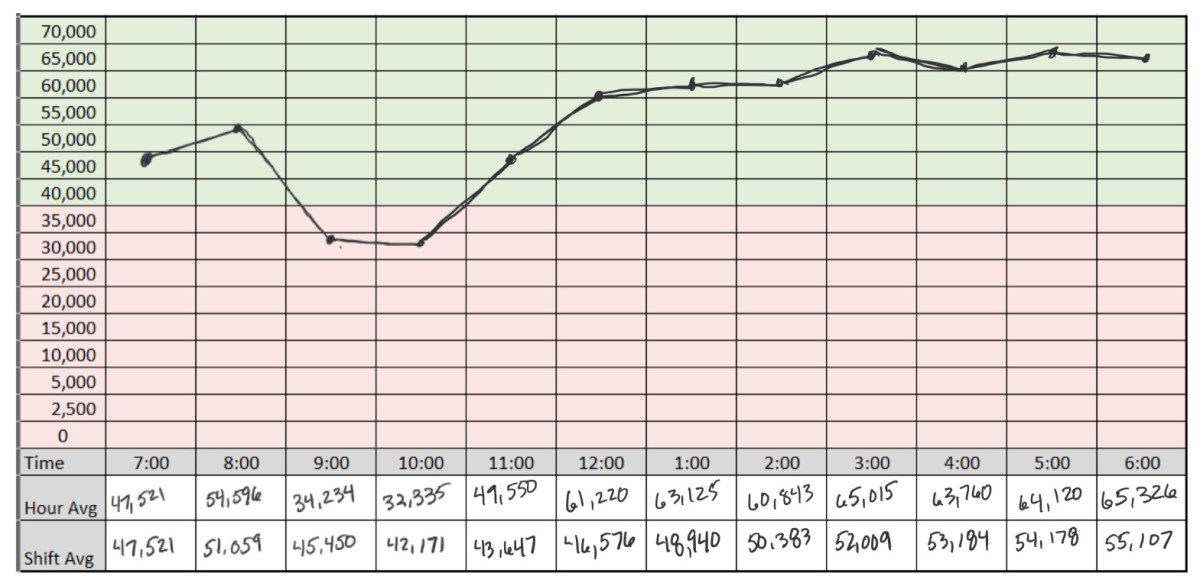
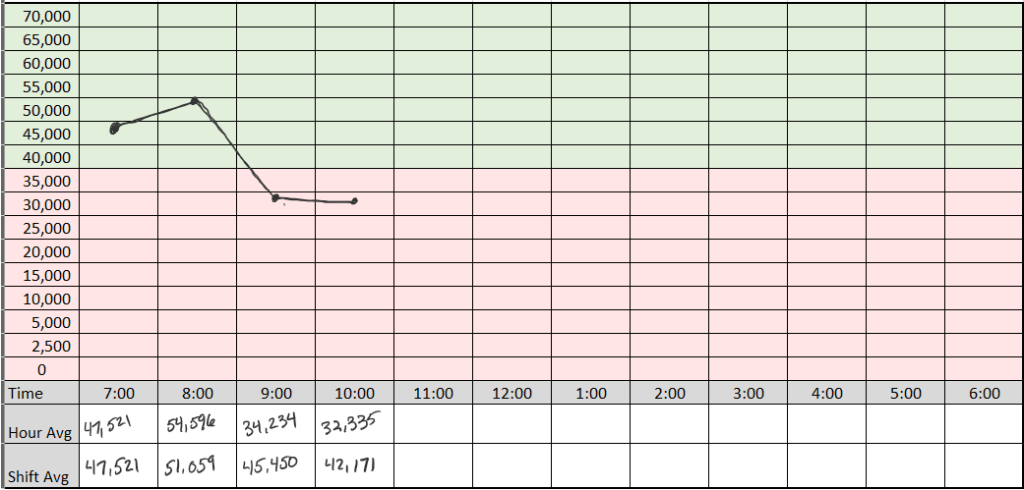
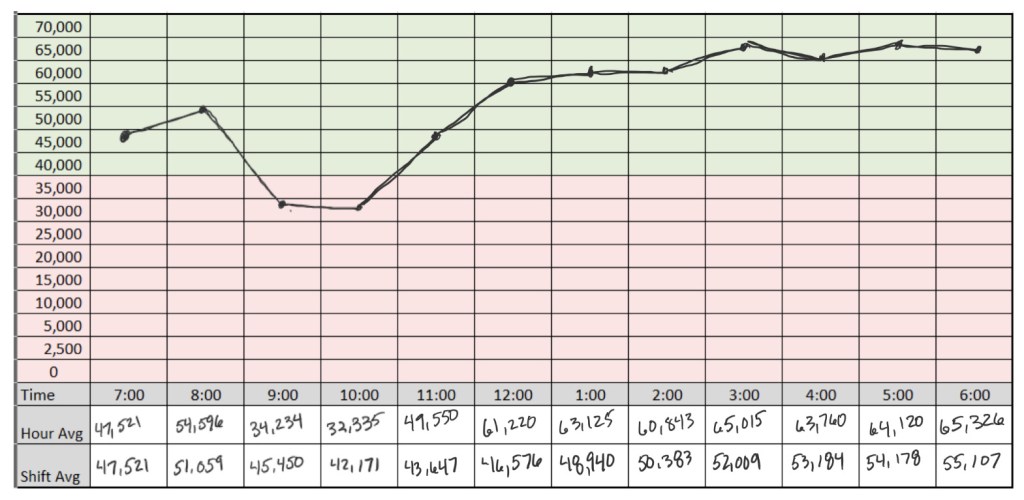
As we implemented the system live, the boards were placed as close to the machines as possible, where they could be easily seen by everyone on the team. We used color-coded charts and graphs to display the KPIs, which made it easy for everyone to understand the data.

Step 4: Updating the Visual Management Board Regularly

We updated the visual management board regularly, ensuring that the KPIs were accurate and up-to-date. This allowed everyone to track their performance and make improvements where necessary. We also provided regular feedback to our hourly team members and operators on their performance and how they were contributing to the overall success of the business.

Step 5: Celebrating Success

Finally, we celebrated success by recognizing the achievements of our hourly team members and operators. This helped to promote a positive and motivated work environment, and it encouraged everyone to continue working towards our shared goals.

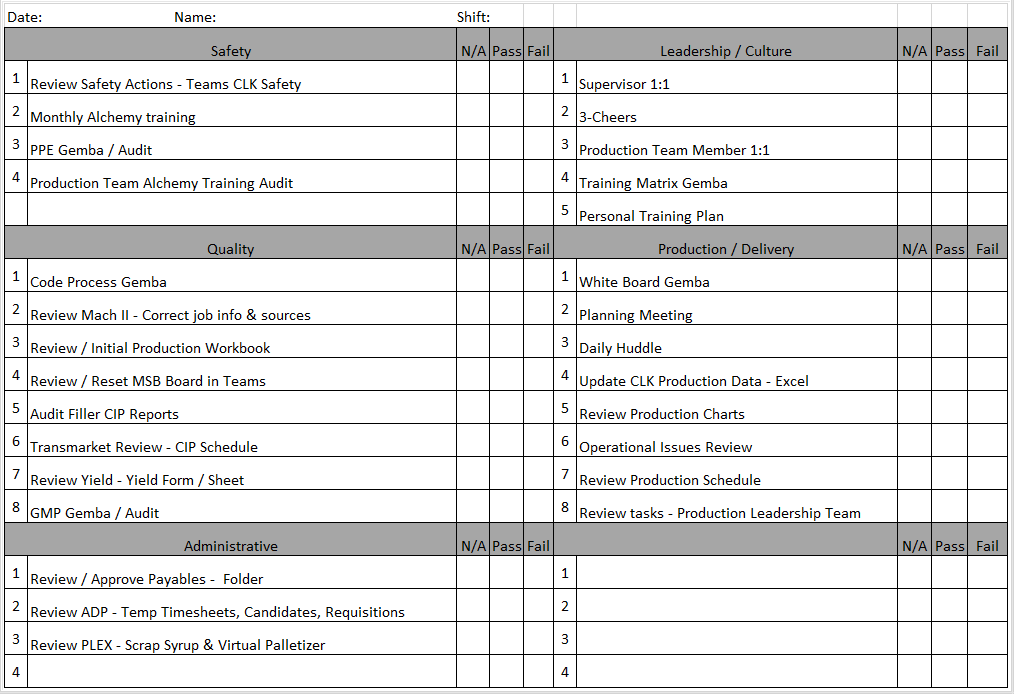
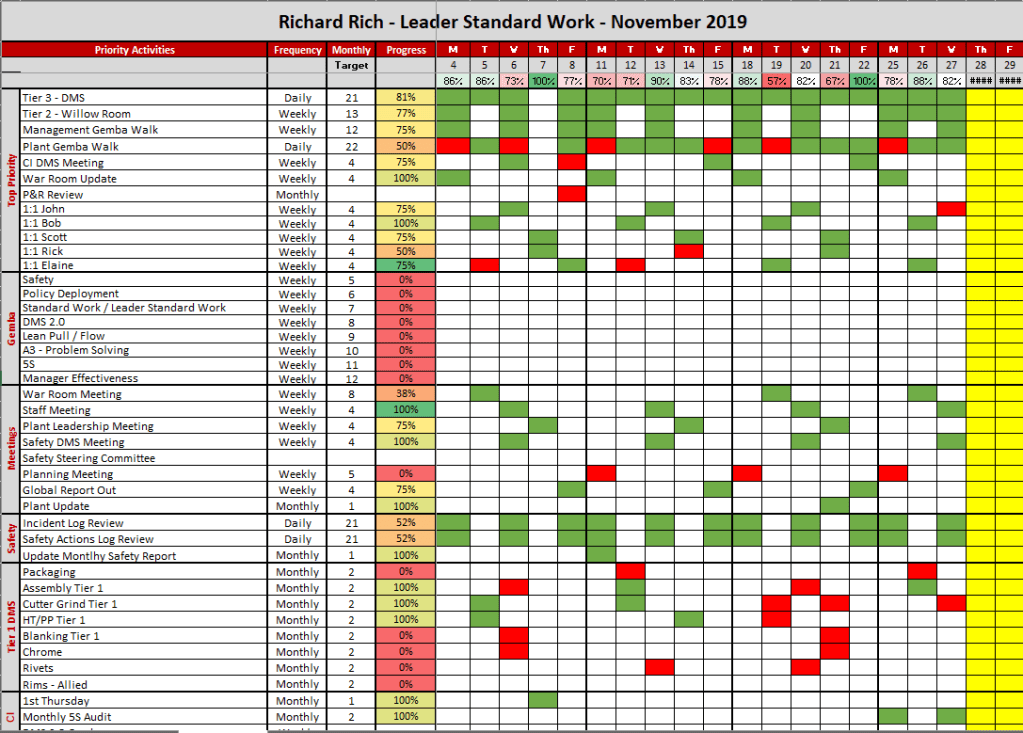
Step 6: Management Gemba Walks

Don’t forget about your Management Gemba Walks.

The purpose of management Gemba walks in a visual management system is to enable managers to observe and evaluate how work is being performed in the workplace. Gemba is a Japanese term that means “the real place” or “the place where work is done.” Gemba walks are a management technique that involves going to the actual location where work is being performed, observing the process, and talking to the employees who are performing the work.

In the context of a visual management system, Gemba walks allow managers to see how the system is functioning in practice, identify any issues or problems, and make necessary improvements. Visual management systems are designed to make information about processes, performance, and quality visible and easily understandable, so Gemba walks can be used to ensure that the information being presented is accurate and up-to-date.

Our managers do their formal Gemba twice a week to observe as close to the machine as possible. By actively engaging with employees and observing the process in action, managers can gain a deeper understanding of how work is being done, identify any inefficiencies or areas for improvement, and provide feedback to the team. Gemba walks also provide an opportunity for managers to build relationships with employees, demonstrate their support for the team, and reinforce the importance of continuous improvement

In conclusion, updating our visual management board with KPIs has been a valuable process. It has helped us to promote collaboration, teamwork, and a shared understanding of our goals. By involving our hourly team members and operators in the process, we have been able to improve production efficiency, product quality, and customer satisfaction.

New Year, New Leader Standard Work (LSW)

When implementing LSW in a production environment, it is important to involve all members of the production team in the process. This can help to ensure that everyone has a clear understanding of their roles and responsibilities and that they are fully committed to the implementation of LSW.

It is that time of the year again. Reviewing budgets, strategies, etc. One thing that I am currently working on is updating my Leader Standard Work to align with our updated goals for 2023.

Leader Standard Work (LSW) is a tool that can be used to effectively manage production systems. It is a set of procedures and processes that outline the specific tasks and responsibilities of leaders and managers in a production environment. By following LSW, leaders and managers can ensure that their teams have the necessary information and resources to perform their jobs effectively and efficiently.

One of the key benefits of LSW is that it helps to standardize the way that work is done in a production environment. This can help to reduce variability and improve the overall quality of the products or services being produced. It also helps to ensure that all employees are working to the same standards, which can improve communication and collaboration among team members.

Another benefit of LSW is that it helps to ensure that leaders and managers are aware of any issues or problems that may arise in the production process. This can help them to quickly identify and address any problems, which can help to prevent delays and minimize the impact of any disruptions to the production process.

When implementing LSW in a production environment, it is important to involve all members of the production team in the process. This can help to ensure that everyone has a clear understanding of their roles and responsibilities and that they are fully committed to the implementation of LSW. It is also important to provide training and resources to employees, to help them understand and effectively implement the new procedures and processes.

Here is the draft LSW that I am working with.

To effectively monitor and maintain LSW, management must establish visual management systems such as Andon, KPI boards and process mapping. These visual tools helps to track the performance of the processes, identify problems and quickly address them. The data from the visual management systems is used for continuous improvement and to make necessary adjustments to the LSW procedures.

Overall, LSW is a powerful tool for managing production systems and can help to improve the efficiency and quality of the production process. By standardizing the way that work is done, leaders and managers can ensure that their teams have the necessary information and resources to perform their jobs effectively and efficiently. Additionally, LSW can be used to quickly identify and address any issues that may arise in the production process, helping to prevent delays and minimize the impact of disruptions.

The Shift Playbook

“How do we know what to improve if we don’t know what’s happening?”

Six Questions that Guarantee Your Daily Win

Using SPC or Statistical Process Control charting and basic time tracking for downtime/defects

The backstory is that we were in the middle of our ramp up phase in the new plant.  Managers, supervisors, and operators alike were all learning the equipment and production processes.  We were struggling to improve performance.  In a discussion with the team the comment was made – “how do we know what to improve if we don’t know what’s happening?”  We had machine data available. We have various HMI screens that give current machine performance. But, as a whole integrated production line, we did not have visibility of how everything worked together.

That gap birthed the shift playbook.  It was designed to give the supervisors a current state performance metric by capturing the hour by hour performance, visualizing the previous hour and the shift trend, identifying targets, and tracking abnormal conditions or events that led to downtime.

There are two parts.  The first one is a standard SPC chart that displays each hour slot of a twelve hour shift.  The minimum shift average of 40,000 parts per hour is designated by a change of color from green to red…simple yet genius

SPC Chart – The First Three Questions

The SPC chart is used to answer the following three questions:

  1. How did we do?
  2. How are we doing?
  3. If nothing changes – where will we end up?

How did we do?

Depending on your operation there can be differing amounts of variation in your production process.  Analyzing this particular process it was decided that hour by hour would be the optimal measurement and would allow some variability that occurs through each sixty minute cycle to normalized over time. 

At the end of the hour, the supervisor places a dot on their playbook sheet in the closes square that represents the actual production performance number.  Plotting the following data would result in the following visual representation:

  • 06:00 – 07:00 – 47,521
  • 07:00 – 08:00 – 54,596
  • 08:00 – 09:00 – 34,234
  • 09:00 – 10:00 – 32,335

Answering the question “how did we do?” is easy when represented with a simple SPC chart.  We can see that we started off fine, things got better and then something happened that caused productivity to fall below our target minimum.

How are we doing?

We can also answer the question “how are we doing?’ by looking at the number in the shift average row.  We see that given the current hourly performance, the shift average is starting to go down.  It is easy to see that we are at risk.

If nothing changes – where will we end up?

A short while ago, I was doing a Gemba walk with the on-shift supervisor.  We reviewed the Shift Playbook for the current state.  It was a similar situation – the dots were pointing in a downward direction.  I called an all-hands meeting on the production floor with the supervisors and leads.  We looked at the playbook as a group.  When I asked the question – “If nothing changes where will we end up by the end of the shift?”  Everyone knew the answer.  If nothing changes we will either continue to decline or remain below goal for the shift.

That quick answer then led us to the next section of the playbook where we answer the second set of questions.

The Production Delay Log

The production delay log is a simple yet powerful tool when combined with the SPC chart above.  It helps answer these questions:

  1. What is getting in our way?
  2. What impact is it having?
  3. What do we need to focus on to improve?

We had decided as a team that just like tracking the hour by hour at a minimum, that there was too much noise and busyness to track every delay.  We aligned that we would only track incidents that resulted in delays greater than 10 minutes.  Your operation may be mature enough to tighten the interval for tracking but as a startup facility we found it more value added to address the larger items first. 

This would also keep us focusing on the critical items and not chasing everything.

Reviewing a sample delay log that would match the SPC chart example above we would see the following:

By keeping a general production delay log the information from different machines or areas of the production line can be brought together to see if there are any patterns. 

The data answers the last two questions.  5/6 or 83% of our delay is caused by the occurrence of twisted cases getting to machine 3.  We can also see that of the total downtime, approximately 60 minutes – 50 minutes are caused by one type of incident. 

It is easy to see the pattern here.  When the team reviewed the playbook there was agreement that we need to Gemba machine 3 and see where the problem is coming from.

That is exactly what we did.  The whole team went to machine 3 to watch the delay happen.  While we were there we saw a twisted case arrive – already twisted.  We decided to move upstream.  We went to the next machine which was a combiner.  It takes two different source conveyors and combines them into one line a moves them to a palletizing machine.

We watched for about ten to fifteen minutes and then it happened.  We saw a case get hung up on one of the side / edge rollers that merged the case to the other line.  It didn’t happen every time but as we continued to watch we noticed that upon closer inspection, every case looked like it bumped something – it caused the case to shift slightly.  The severity of it was random.  Every ten to fifteen minutes it was severe enough to cause the case to turn 90 degrees and stop machine 3 downstream. 

We called maintenance right away who made a slight adjustment to the angle.  We then stayed to validate whether our hypothesis was correct.  The “bump” was gone and no repeats of the incident occurred over the next thirty minutes.

The playbook was completed with a much improved hour by hour and upward moving average.  By the end of the shift the team finished with the fifth highest shift production record as of that date.

Summary

Using and combining the two simple yet effective tools – an SPC chart and production delay log into a Shift Playbook can provide the data and visualization to help your team know what defines winning, understand the current state, and identify roadblocks that are preventing them from winning. 

DMS 2.0 – Process Flow

Your data displayed is either visible or visual. If the data is displayed and your business is “business as usual” then your data is visible – not visual. If it triggers actions based on gap identification resulting in an improved process then it is visual.

Visual Verses Visible

The first step is for data to be made “Visual.” I use the word “visual” with intention as opposed to being visible. Being “visible” just means that the information can be seen. When data is “visual” it has meaning. It can be understood quickly and easily. Interpreting the data is not ambiguous because it is designed to display in a binary format – “Did we hit the target as planned?”

A way to tell if your data in your visual management system is just visible or qualifies as visual is to review it on a regular cadence such as a Gemba walk. If you see that the chart or graph is not updated regularly or if few people who use the board know when and what to do if a trigger condition happens you have a visible display, i.e. fancy wallpaper.

Visual Management as Process

Visual Management – like the other three elements is a process

  1. Step one is to use “meaningful data” that accurately reflects the current state of our performance and makes it quick and easy to see and understand the “Actual” verses “Planned” or “Target” state.
  2. Since we are focusing on “process” and not “people,” our gaps fall into either of two categories:
    • Performance Gap – Was the process followed? Was standard work or Leader Standard Work completed as designed?
    • Process Gap – Standard Work / Leader Standard Work is designed to produce expected results. If Standard Work is performed as designed and a gap exists, that reveals that the process is not capable as designed so we need to correct or improve the process (the way we do the work).
  3. Step three is to take the appropriate action
    • For performance gaps – coaching or accountability systems are used to improve adherence to standard work.
    • Process gaps result in either improvement (Kaizen) or problem-solving to make the process capable of meeting the target condition.

Summary

Your data displayed is either visible or visual. If it triggers actions based on gap identification resulting in an improved process then it is visual.

If the data is displayed and your business is “business as usual” then your data is visible.

Both may look good. Only one will work to drive the improvements you are hoping to make with your visual management system.

I would love you hear your thoughts on this. Leave a comment or send an email.

-Rich

Leader Standard Work – PDCA

The art of using LSW as an improvement tool is to be able to read the sheet with your “process” eyes. What this means is not to focus on reds and ask “why didn’t they get done?” What you are looking for as a lean leader are process gaps.

Updating my LSW – reviewing November for lessons learned and applying PDCA to December’s LSW plan

Download a copy of the Excel template used in this post by clicking the link below

Introduction

Leader Standard Work is a leaders visual management system much like a DMS board, Kamishibai, or other lean visual control. The intent is to regularly review (monthly in my case) for opportunities for process improvements (reds) and apply those improvements to the next cycle. Visual Leader Standard Work will reveal two types of gaps: performance and process.

Performance gaps are simple – “was the task completed?” Performance gaps require deeper learning and analysis. In this post it will be assumed that there are no performance gaps to address – only process gaps.

The Review

The image below is of my LSW for November.

The art of using LSW as an improvement tool is to be able to read the sheet with your “process” eyes. What this means is not to focus on reds and ask “why didn’t they get done?” What you are looking for as a lean leader are process gaps.

Each behavior or activity of a leader in a lean management system is to sustain process improvements where that same process stability will provide the foundation for further improvements. The focus is on process.

Assuming that there are no performance gaps (the activity was completed as planned) we can move to what constitutes process gaps. Reds will indicate one of two possibilities.

  1. The behavior or activity (audit, Gemba, etc.) is not able to sustain the process. You are unable to really “see” the process in order to measure the expected state verses the current state.
  2. The process is not adequate to sustain the improvement. In this case a red means that you are able to clearly see the expected state and current state but something is not working right – there is a gap, a problem, or a variation.

Lessons Learned

After review it is time to see what you can learn about the process. Analyze the patterns.

In the example above I saw groupings around a particular time of day for attending Tier 1 DMS meetings. The conflict that created the reds were clear and recorded on the paper version that I carry daily. Each one that is missed was due to overlapping requirements at other DMS meetings. It had nothing to do with performance and everything to do with the fact that one cannot be in two places at the same time.

Planned Improvements

The lessons learned from reviewing November’s LSW were used to create December’s.

  1. Space for attendance at the conflicting Tier 1 DMS meetings was created
  2. Communication for Tier 3 DMS attendance plan was provided and aligned to with my manager
  3. Activities planned for early mornings where Tier 1 DMS meetings happen are now planned for later in the day.

Summary

It’s December 1st. Tomorrow is Monday, December 2nd. Is your LSW reviewed and updated? Have you made a plan to sustain the lean improvements?

Take a few moments and reflect on what learned from last month adn make an improvement to be a better lean manager for December